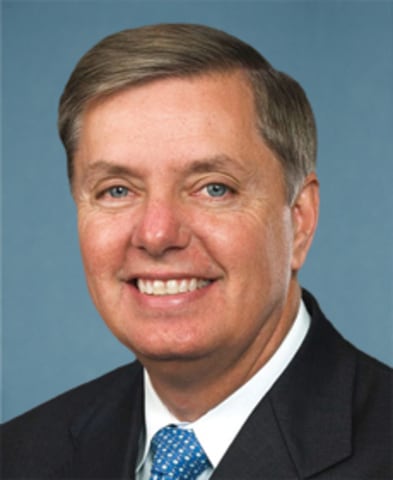
What the payments were for $22,177,274 itemized
The campaign also refunded $19,100 in contributions, which the categories below do not include.
Tap a row with to see what was paid for.
Advertising and mediaBroadcast, digital, and print advertising, and the media buying behind it.$14,495,73265%
Filed as
- MEDIA$9,818,630
- DIGITAL MEDIA$3,645,379
- DIGITAL ADVERTISING$648,447
- POLITICAL STRATEGY CONSULTING/MEDIA$333,847
- POLITICAL STRATEGY CONSULTING/SOCIAL MEDIA$28,574
- VIDEOGRAPHY & PHOTOGRAPHY SVCS$10,354
- MEDIA PRODUCTION$9,800
- PRINT ADVERTISING$700
Paid to
- Scott Howell & Co. Inc$9,811,784
- Push Digital LLC$4,203,092
- First Tuesday Strategies LLC$273,993
- Forward Communications + Strategies$98,782
- Campaign Solutions Inc$60,917
- Mass Markets$29,817
TransfersMoney moved to an affiliated or authorised committee.$1,575,8097.1%
Filed as
- TRANSFER TO AFFILIATED COMMITTEE$1,575,809
Paid to
- NRSC$1,535,809
- South Carolina Republican Party$40,000
Consulting and strategyStrategic, political, legal, and compliance consulting, and campaign management.$1,305,1385.9%
Filed as
- POLITICAL STRATEGY CONSULTING$821,874
- POLITICAL STRATEGY CONSULTING/DIRECT MAIL$173,096
- COMPLIANCE CONSULTING$115,147
- POLITICAL STRATEGY CONSULTING/PRINTING-MAIL$64,067
- POLITICAL STRATEGY CONSULTING/EXPENSE$58,550
- LEGAL CONSULTING$35,030
- LEGAL SERVICES$14,250
- POLITICAL STRATEGY CONSULTING EXPENSE$9,746
- ACCOUNTING SERVICES$7,100
- COMPLIANCE CONSULTING/EXPENSE$5,037
- ACCOUNTING SOFTWARE$1,242
Paid to
- First Tuesday Strategies LLC$513,967
- Forward Communications + Strategies$317,708
- Rightside Compliance$120,184
- Advancing Strategies LLC$116,672
- RCH Associates$85,000
- Farmer Strategies LLC$47,035
Polling and researchSurveys, opposition research, voter file work, and analytics.$914,2384.1%
Filed as
- POLLING$498,700
- SURVEY RESEARCH$242,800
- DATA MANAGEMENT SERVICES$91,496
- POLLING/DATA ANALYSIS$48,700
- POLLING & DATA ANALYTICS$15,000
- DATA ANALYTICS SERVICE$12,543
- DATA ANALYTICS$5,000
Paid to
- Meeting Street Research LLC$408,000
- Deep Root Analytics LLC$292,300
- Opinion Diagnostics$108,700
- Cmdi$86,974
- Numinar Analytics$12,543
- Clockwork Systems$4,521
Printing, mail, and shippingPrinted literature, direct mail, postage, design, and delivery.$823,1133.7%
Filed as
- DIRECT MAIL EXPENSE$557,859
- DIRECT MAIL$164,263
- PRINTING/POSTAGE$59,863
- CAMPAIGN SIGNS$29,260
- POSTAGE$4,247
- PRINTING$4,227
- GRAPHIC DESIGN/PRINTING$3,239
- OFFICE SUPPLIES/PRINTING$156
Paid to
- First Tuesday Strategies LLC$517,727
- Moore Response Management Group$140,243
- Steve Brown Direct Marketing LLC$60,380
- South Carolina Republican Party$50,000
- Victory Enterprises Inc$29,260
- Sun Solutions Inc$15,499
Taxes, fees, and bank chargesPayroll and income taxes, filing fees, bank and merchant processing charges.$652,3382.9%
Filed as
- TAXES$490,896
- PAYROLL TAXES$140,829
- BALLOT ACCESS FEE$10,440
- BANK CHARGES$10,134
- EVENT REGISTRATION FEE$40
Paid to
- Internal Revenue Service$404,041
- Scdor$116,708
- IRS$110,333
- South Carolina Republican Party$10,440
- Truist$10,134
- SC Dept of Employment & Workforce$644
Fundraising and eventsThe cost of raising money: finance consultants, donor list rental and acquisition, event venues, catering, and donor processing.$598,2002.7%
Filed as
- FUNDRAISING CONSULTING$257,168
- EVENT CATERING$121,407
- DIGITAL FUNDRAISING$46,079
- FUNDRAISING CONSULTING/EXPENSE$33,406
- FUNDRAISING CONSULTING & EXPENSE$29,436
- FUNDRAISING CONSULTING/FR EXPENSE$26,089
- FUNDRAISING CONSULTING EXPENSE$15,271
- EVENT FACILITY EXPENSE$9,055
- EVENT STAGING/LIGHTING/SOUND$8,846
- CATERING$7,082
- LIST RENTAL EXPENSE$6,375
- EVENT EQUIPMENT$6,340
Paid to
- Palmetto Development Strategies LLC$262,213
- The Townsend Group$114,002
- Campaign Solutions Inc$46,079
- Bistro Cacao$14,656
- Hawks Public House$14,221
- Marriott Hotels$11,194
Payroll and staffSalaries, wages, benefits, and payroll services.$438,3452%
Filed as
- PAYROLL$436,211
- PAYROLL SERVICES$2,133
Paid to
- Worthen, Caleb$129,494
- Blackstone, Mary Thomas$50,938
- Zilch, Abigail B.$44,871
- Densmore, Samuel$38,712
- Kimbrell, Conner a.$30,380
- Vess, Olivia C.$29,926
Digital and technologyWebsites, hosting, software subscriptions, databases, email, and texting platforms.$424,7451.9%
Filed as
- TEXT MESSAGING$239,105
- TEXT MESSAGING SERVICES$73,293
- DATABASE SUBSCRIPTION$64,024
- TEXT MESSAGING SERVICE$42,005
- SUBSCRIPTION$4,588
- DATABASE MANAGEMENT SERVICE$1,000
- WEB SERVICES$592
- STORAGE UNIT SUBSCRIPTION$139
Paid to
- Advotext LLC$279,093
- Tatango$64,292
- Numinar Analytics$64,024
- Push Digital LLC$9,017
- Dropbox$3,888
- Campaign Solutions Inc$2,592
Field and canvassingDoor-to-door canvassing, phone banks and calls to voters, petition and signature gathering, and get-out-the-vote work.$370,0001.7%
Filed as
- CANVASSING/VOTER CONTACT$250,000
- VOTER CANVASSING$80,000
- CANVASSING$40,000
Paid to
- Field Forward LLC$330,000
- Infield Strategies$40,000
TravelAirfare, lodging, mileage, and ground transport.$207,1390.9%
Filed as
- TRAVEL$169,163
- TRAVEL - MILEAGE$32,894
- TRAVEL-MILEAGE$4,333
- TRAVEL - MEALS$749
Paid to
- Delta Airlines$34,918
- American Airlines$34,143
- Hilton Hotels$24,834
- Marriott Hotels$16,105
- Densmore, Samuel$8,550
- United Airlines$7,364
Card paymentsPaid to a card processor with no itemisation filed beneath it, so the purchases behind it are not on the record.$170,3850.8%
Filed as
- CREDIT CARD PAYMENT$123,065
- CREDIT CARD MERCHANT FEES$47,320
Paid to
- Barclay Card$59,409
- Citicard$44,378
- Democracy Engine LLC$27,298
- American Express$19,279
- Anedot$12,604
- WinRed Technical Services LLC$6,872
OtherPayments whose filed description does not match any category above. Every one is listed so it can be read directly.$115,0650.5%
Filed as
- TELEPHONE TOWNHALL SERVICE$55,176
- TELEPHONE TOWN HALL SVCS$16,981
- TELE-TOWNHALL SERVICES$14,581
- ALARM SYSTEM EQUIP/INSTALLATION$8,920
- PO BOX RENTAL$4,088
- EXPRESS DELIVERY$3,214
- TELEPHONE SERVICES$2,636
- CAMPAIGN MERCHANDISE$2,474
- COMPUTER SERVICES/SUPPORT$1,733
- DIGITAL SERVICES$1,576
- PO BOX RENEWAL$1,085
- POSTAL BOX RENTAL$1,022
Paid to
- Campaign HQ$86,739
- ADT$8,920
- US Postal Service$4,088
- Fedex$3,693
- Verizon Wireless$2,636
- Iotech Team LLC$1,733
Office and administrativeRent, utilities, phones, supplies, equipment, security, food, and campaign merchandise.$45,9250.2%
Filed as
- RENT$22,792
- UTILITIES$8,810
- OFFICE SUPPLIES$4,214
- WIRELESS TELEPHONE SVCS$1,651
- ONLINE FILE STORAGE$1,376
- INSURANCE$1,301
- OFFICE MAINTENANCE$1,135
- STORAGE$918
- OFFICE CLEANING SERVICES$700
- MEALS$626
- STORAGE UNIT RENTAL$612
- EQUIPMENT LEASE EXPENSE$499
Paid to
- Colonial Village$17,426
- Dominion Energy$5,694
- NAI Earle Furman LLC$5,366
- Spectrum$1,825
- CS&S LLC$1,704
- Verizon Wireless$1,651
Given to othersContributions to other candidates, party committees, and PACs.$37,6000.2%
Filed as
- CONTRIBUTION DISGORGEMENT$33,600
- CONTRIBUTION TO COMMITTEE$4,000
Paid to
- U.S. Treasury$33,600
- Darline for Senate$4,000
Refunds and redesignationsContributions returned to donors or reassigned to another election.$3,500<0.1%
Filed as
- CONTRIBUTION REFUND - GEN 2026$3,500
Total itemized disbursements $22,177,274
Every itemized payment the committee reported this cycle, sorted by what it said each one was for. The categories are ours; the wording they are matched against is the committee’s own. Open a category to read the filed descriptions and who was paid. FEC filings through Sep 30, 2026.
All 1,489 itemized payments filed this cycle. Spending below the itemization threshold is not filed line by line.
81 payments were reported as a lump sum, such as a card or payroll bill, with the detail filed underneath as memo entries. Those entries, $422,789 in all, are counted under the payee and purpose they name rather than under the processor that was paid. The total is the same either way.